Code
from datasets import load_dataset

dataset = load_dataset("cardiffnlp/tweet_topic_single", split="train_2021")
embeddings = OpenAIEmbeddings(chunk_size=1000).embed_documents(dataset["text"])Clustering is unsupervised machine learning for not having a target variable or class label. Clustering takes unlabeled data as input and group them into several clusters based on certain similarities. They are many types of clustering methods, let’s take a look at some examples:

Partitioning clustering is a method of clustering data points into a set number of groups, while hierarchical clustering is a method of creating a hierarchy of clusters, with each cluster containing a subset of the data points. Partitioning clustering is typically faster than hierarchical clustering, but hierarchical clustering can produce more accurate results.
Agglomerative: A bottom-up approach where each data point starts in its own cluster, and pairs of clusters are merged as one moves up the hierarchy.
Divisive: A top-down approach starting with all points in one cluster and recursively splitting them into smaller clusters.
We can understand this algorithm by thinking of our data points to be represented as a probability density function. Naturally, in a probability function, higher density regions will correspond to the regions with more points, and lower density regions will correspond to the regions with less points. In clustering, we need to find clusters of points, i.e the regions with a lot of points together. More points together mean higher density. Hence, we observe that clusters of points are more like the higher density regions in our probability density function. So, we must iteratively go from lower density to higher density regions, in order to find our clusters.

Clustering can be used for a variety of tasks, such as
Recommendation systems: Recommendation systems group similar items together and discover underlying connections without pre-defined categories. It recommends similar content and identifies customer segments for marketing purposes.
Search engines: Search engines try to group related objects together in a cluster and place different things far apart. It produces search results for the desired data based on the closest comparable items which are grouped around the desired search standards.
Topic modeling: Topic modeling is a method used in text mining to discover abstract topics within a collection of text crops. Perform clustering on the reduced text feature space to get groups of text crops, and each cluster can be interpreted as a topic.
HDBSCAN stands for Hierarchical Density-Based Spatial Clustering of Applications with Noise, which is a a density based (hierarchical) clustering algorithm. HDBSCAN is a versatile clustering algorithm that can handle complex real-world data sets with varying densities and noise. Therefore it’s used in a wide range of domains, especially for high-dimensional data such as image clustering, anomaly detection, and topic modeling, for the ability to handle different data sizes and shapes and pre-select the number of clusters.
In the following parts, I will share an example of using HDBSCAN for topic modeling. First, let’s retrieve some Twitter post data from Huggingface and use OpenAI to obtain the embeddings for clustering.
from datasets import load_dataset
dataset = load_dataset("cardiffnlp/tweet_topic_single", split="train_2021")
embeddings = OpenAIEmbeddings(chunk_size=1000).embed_documents(dataset["text"])Check the size of embeddings:
tensor=np.array(embeddings)
tensor.shape
(1516, 1536)Since the embeddings are of very high dimensions, we will perform a simple dimension reduction technique.
import numpy as np
import pandas as pd

# For plotting
from matplotlib import offsetbox
import matplotlib.pyplot as plt
import seaborn as sns
from sklearn.manifold import TSNE

tsne = TSNE(random_state = 1, n_components=2,verbose=0).fit_transform(tensor)
tsne.shape
(1516, 2)Next, we preprocess the data into a cleaner dataframe and apply HDBSCAN to this 2-dimensional data to obtain the cluster labels.
cluster = hdbscan.HDBSCAN(min_cluster_size=20, prediction_data=True).fit(tsne)

df = pd.DataFrame({
    "tweet": dataset["text"],
    "label": dataset["label_name"],
    "cluster": cluster.labels_,
    "tsne_1": tsne[:, 0],
    "tsne_2": tsne[:, 1]
})

df = df[df["cluster"] != -1] #remove outliers

df.head(5)| tweet | label | cluster | tsne_1 | tsne_2 | |
|---|---|---|---|---|---|
| 0 | Barbara Bailey is the queen of broadcast news ... | pop_culture | 2 | 14.320232 | -10.883064 |
| 3 | There s regular people and then there s {@Bail... | pop_culture | 2 | 15.338669 | -10.596313 |
| 5 | I m still ticked at {@NBC Sports@} for moving ... | sports_&_gaming | 1 | -21.025387 | -2.219523 |
| 7 | you cannot simultaneously prepare and prevent... | pop_culture | 2 | 14.908103 | -17.337248 |
| 8 | The time is now! The 1st edition of the 192 ... | arts_&_culture | 2 | 10.824976 | 3.334099 |
We can use ChatGPT to understand our clusters better by prompting ChatGPT to provide keywords and a short description for each cluster.
from openai import OpenAI

client = OpenAI()

def cluster_summary(df, sample_size=3):

    summary = []
    for i in tqdm(df['cluster'].unique()):
        sample = df[df['cluster']==i].sample(sample_size, random_state=1)
        s=sample[["tweet"]].to_dict(orient="records")
        print(f'\nAsking the LLM for a summary for cluster indexed {i}. \n')
        content = f"""You will be given a dataset with some tweets. You need to identify the category for those given tweets and shortly describe it. Tweets: {s}"""

        print("Ground truth labels: "+ ", ".join(sample["label"].to_list()))

        response = client.chat.completions.create(
            model="gpt-3.5-turbo",
            messages=[
                {"role": "user", "content": content}],
            temperature=0.5,
            max_tokens=64,
            top_p=1
        )
        print(response.choices[0].message.content)

        summary.append(response)

cluster_summary(df,3)
0%| | 0/5 [00:00<?, ?it/s] 20%|██ | 1/5 [00:02<00:10, 2.59s/it] 40%|████ | 2/5 [00:04<00:06, 2.31s/it] 60%|██████ | 3/5 [00:07<00:04, 2.33s/it] 80%|████████ | 4/5 [00:09<00:02, 2.28s/it]100%|██████████| 5/5 [00:11<00:00, 2.30s/it]100%|██████████| 5/5 [00:11<00:00, 2.32s/it]
Asking the LLM for a summary for cluster indexed 2.

Ground truth labels: science_&_technology, arts_&_culture, daily_life
The first tweet is related to the category of "COVID-19 and Global Health Crisis". It discusses the challenges faced in investigating the origins of the pandemic and emphasizes the need for more transparency from China.

The second tweet is related to the category of "Urban Development and City Planning". It expresses excitement about the development and future

Asking the LLM for a summary for cluster indexed 1.

Ground truth labels: sports_&_gaming, sports_&_gaming, sports_&_gaming
The given tweets can be categorized as follows:

1. Tweet 1: Category - Sports
   Description: This tweet is about a brand new facility at Texas Motor Speedway for the AllStarRace night. It mentions Tyler Reddick leading the field of 22 cars to the start of the race. The hashtag #

Asking the LLM for a summary for cluster indexed 3.

Ground truth labels: pop_culture, pop_culture, pop_culture
Based on the given tweets, the categories and descriptions are as follows:

1. Music Promotion: The first tweet is promoting an album by the artist Ace Word, encouraging people to listen to it on various music platforms. It mentions Burna Boy, Wizkid, and Cool FM Nigeria 96.9 as well.


Asking the LLM for a summary for cluster indexed 0.

Ground truth labels: sports_&_gaming, sports_&_gaming, sports_&_gaming
Category: Sports

Description: The given tweets are related to a sports event, specifically a fighting match. The tweets mention the fighters, their performance in the rounds, and the sportsmanship displayed. The first tweet mentions a specific fighter and their performance in the first round. The second tweet shows respect for both fighters and discusses

Asking the LLM for a summary for cluster indexed 4.

Ground truth labels: pop_culture, pop_culture, pop_culture
Category: BTS Fan Support

Description: The given tweets are related to the K-pop group BTS. The first tweet congratulates BTS on winning an award for Best Dance Performance Male Group. The second tweet provides updates on the rankings of BTS songs on Spotify Philippines Top 200. The third tweet expresses the user's liking for
Finally, let’s visualize our clusters to see how HDBSCAN works!
plt.scatter(df["tsne_1"], df["tsne_2"],s=5, c=df["cluster"])
plt.gca().set_aspect('equal', 'datalim')
plt.colorbar()
plt.title('Tweets topic t-SNE', fontsize=20)
Text(0.5, 1.0, 'Tweets topic t-SNE')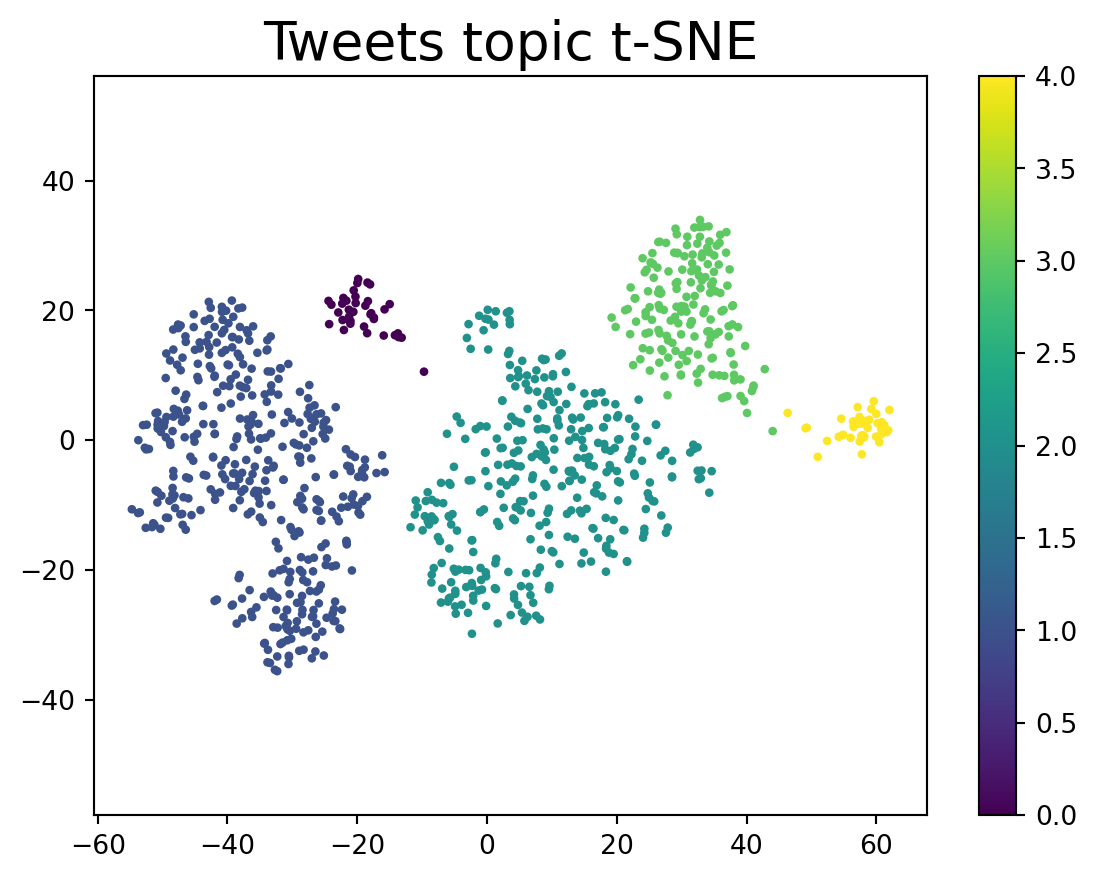
We can also visualize the clustering results without dimention reduction, let’s see how that works!
cluster = hdbscan.HDBSCAN(min_cluster_size=20, prediction_data=True).fit(embeddings)

df1 = pd.DataFrame({
    "tweet": dataset["text"],
    "label": dataset["label_name"],
    "cluster": cluster.labels_,
})
plt.scatter(tsne[:, 0], tsne[:, 1],s=5, c=df1["cluster"])
plt.gca().set_aspect('equal', 'datalim')
plt.colorbar()
plt.title('Tweets topic t-SNE (without dim-reduction)', fontsize=20)
Text(0.5, 1.0, 'Tweets topic t-SNE (without dim-reduction)')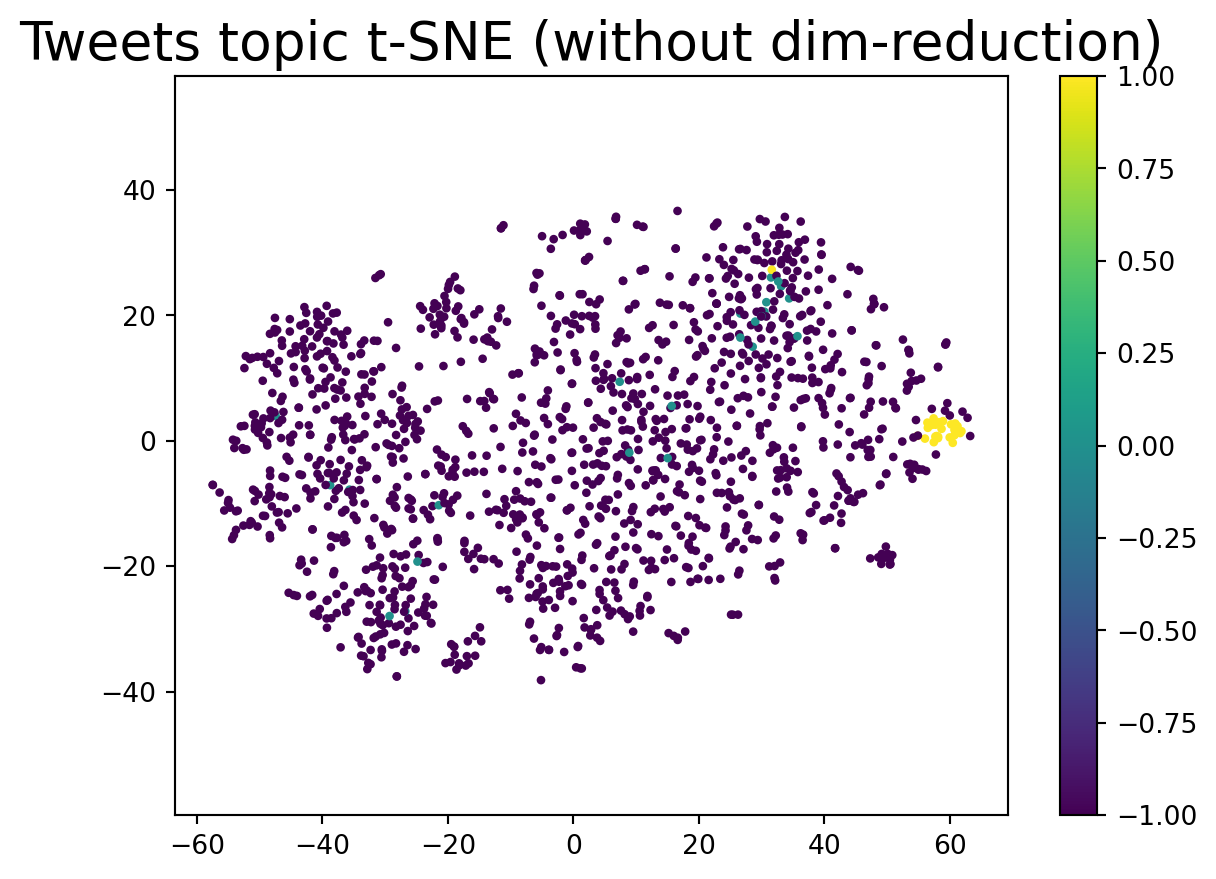
Almost all data points are outliers, the clustering doesn’t work well without dimention reduction. For more about outliers, please check my Anomaly/outlier detection blog!